Cincinnati Housing Market 2026: What Buyers and Sellers Should Know

CINCINNATI HOUSING MARKET • August 2026

The Cincinnati housing market does not move the same way in every county. This July 2026 update compares residential sales in Hamilton, Butler, Warren, and Clermont counties, including median sale prices, closed sales, and how quickly homes sold, so buyers and sellers can better understand what is happening locally.

Request a Local Market Snapshot

What Changed From July 2025 to July 2026?

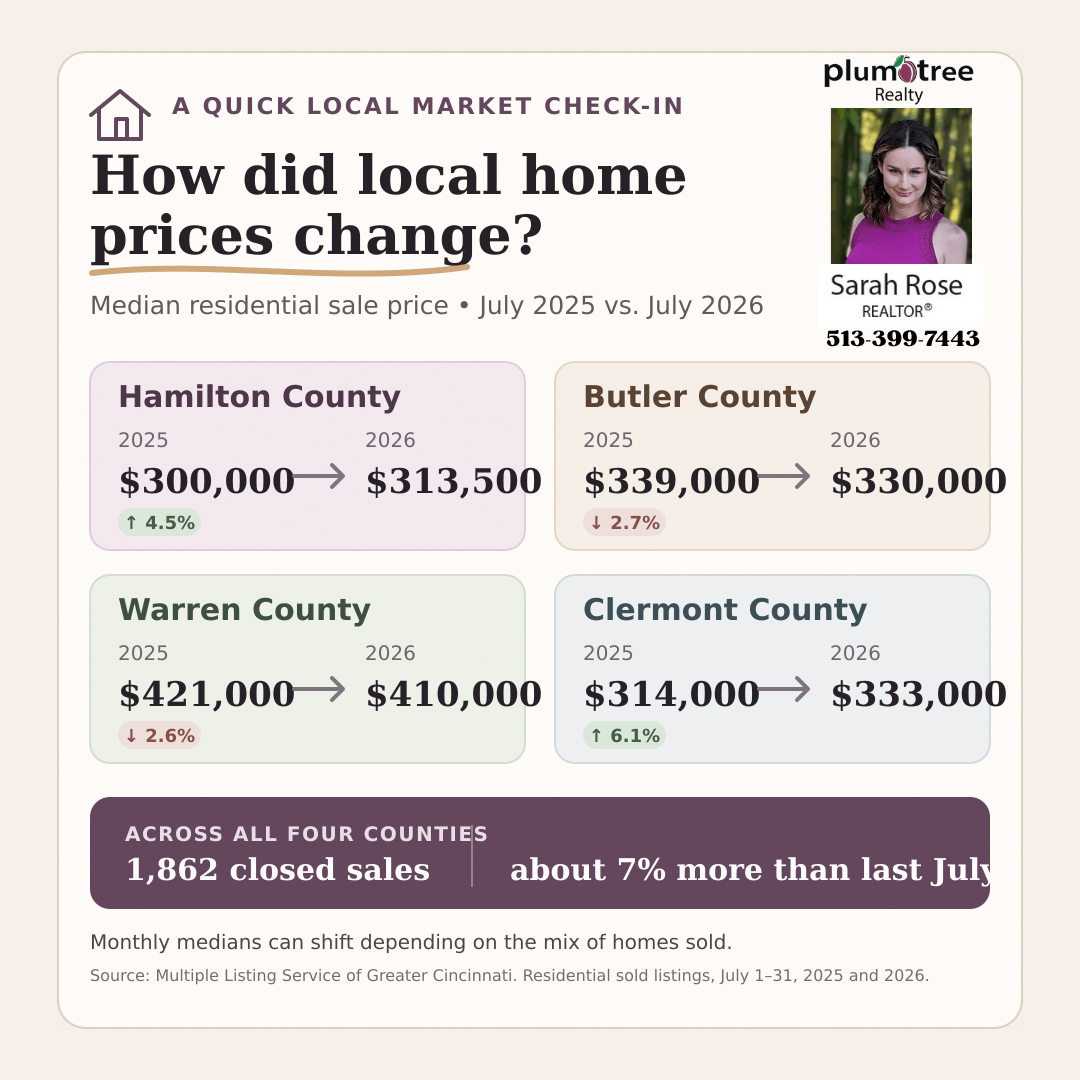
Across Hamilton, Butler, Warren, and Clermont counties, 1,862 residential sales closed in July 2026, compared with 1,738 in July 2025—an increase of about 7%. However, median prices did not move in the same direction in every county, which is why local context matters when evaluating the market.

Chart comparing 2025-2026 of Cinicnnati Real Estate Market
Updated August 2026 | MLS Data

If you’ve been keeping an eye on real estate around town this summer, you’ve probably seen mixed headlines about where prices and buyer demand are heading. The reality? The Greater Cincinnati housing market isn't moving in just one direction—it varies depending on which county, suburb, and price point you're looking at!

Whether you’re planning a move across town, relocating to the area, or just checking in on your home’s value, here is your practical, local look at how our four core Ohio counties performed in July 2026 compared to July 2025.

Closed Sales
1,862
+7.1% YoY
Total Sold Volume
$756.2M
+8.4% YoY
Sold Within 30 Days
80.5%
-3.5 pts YoY
Price Trend
Mixed
County Dependent

Cincinnati Market at a Glance

Market Indicator July 2025 July 2026 YoY Change
Closed Residential Sales 1,738 1,862 +7.1%
Total Sold Volume $697.5 Million $756.2 Million +8.4%
Sold Within 30 Days 84.0% 80.5% -3.5 points

The Big Picture: Overall buyer activity increased across the area, and roughly four out of five homes still sold within their first month on the market. However, pricing trends shifted depending on the county.

July 2026 County-by-County Breakdown

County July 2025 Median July 2026 Median Price Change Sales Change
Hamilton County $300,000 $313,500 +4.5% +4.7%
Butler County $339,000 $330,000 -2.7% +5.1%
Warren County $421,000 $410,000 -2.6% +6.5%
Clermont County $314,000 $333,000 +6.1% +20.5%

Source: Multiple Listing Service of Greater Cincinnati via Rapattoni MLS. Residential sold listings July 1–31, 2025 and July 1–31, 2026; reports generated August 28, 2026.

What’s Happening in Your County?

  • Hamilton County: Recorded 906 closed sales in July (up from 865 last year), with the median price rising 4.5% to $313,500. Around 80% of homes went under contract within 30 days.
  • Butler County: Sales volume grew by 5.1% to 409 closed homes, though the median price dipped slightly to $330,000. Note: A minor dip in median price doesn't mean your home lost value—it often just reflects a higher proportion of entry-level homes closing that month!
  • Warren County: Closed sales rose to 277 homes. While the median price moved to $410,000 (down 2.6%), the median price per square foot actually increased from $222.60 to $224.82. That tells us smaller homes made up a larger share of July sales, while underlying property values stayed strong.
  • Clermont County: Saw the biggest surge in overall activity! Closed sales jumped 20.5% to 270 homes, and median prices rose 6.1% to $333,000.

What This Means for You

🔑 For Home Buyers

Don't let regional broad stats fool you—prices and competition vary wildly between communities.

  • Be Ready to Move: With ~80% of homes selling in under 30 days, great properties in desirable school districts still move fast. Get your pre-approval completed early.
  • Look Beyond the County Median: Evaluate recent neighborhood comps rather than regional averages when structuring an offer.

🏡 For Home Sellers

Increased closed sales show that buyer demand remains healthy across Cincinnati.

  • Pricing Accuracy is Key: Homes updated and priced right from Day 1 move quickly. Overpriced homes sit longer and face negotiation pressure.
  • Stand-Out Marketing: Professional photography and proper preparation make a big difference in capturing early buyer attention.

Frequently Asked Questions

Are Cincinnati home prices still rising in 2026?

It depends on where you look! July median prices increased year-over-year in Hamilton and Clermont counties, while dipping slightly in Butler and Warren counties due to the mix of inventory sold. Neighborhood-level data gives a much clearer picture for your specific address.

How fast are homes selling right now?

Across all four counties, about 79% to 81% of sold homes went under contract within 30 days during July 2026.

Which county has the lowest median sale price?

In July 2026, Hamilton County had the lowest median price among the four counties at $313,500, followed by Butler ($330,000), Clermont ($333,000), and Warren ($410,000).

Explore More Cincinnati Resources

Planning a Move in the Cincinnati Area?

County statistics are a great starting point, but your budget, commute, and lifestyle preferences narrow down your real search. Reach out anytime for a personalized neighborhood and market consultation!

Get in Touch with Sarah
Sarah Rose, Cincinnati relocation Realtor with Plum Tree Realty

About Sarah Rose

I'm Sarah Rose, Realtor with Plum Tree Realty. I create Cincinnati relocation guides, neighborhood resources, and home buying content to help buyers understand what living in Cincinnati Ohio may actually cost day to day.

After moving to Cincinnati myself, I understand how hard it can be to compare housing costs, property taxes, utilities, commute times, and everyday expenses from the outside.

My goal is to make the cost of living in Cincinnati feel easier to understand so buyers can compare areas, plan their budget, and think through the full monthly cost before choosing where to live.

Learn More About Sarah
Cincinnati House Search